ATP 2-33.4, page 40
Intelligence Analysis
Army Techniques Publication: Intelligence Analysis
2014 public edition (Archive.org)
Searchable page text (OCR / PDF)
Chapter 3
3-39. The expression of numerical probabilities can mitigate the imprecision of probability phrases (“very
likely” or “improbable”). Moreover, numerical probabilities mitigate the potential for analysts to exploit
imprecision in favor of their position. Using numerical probabilities ensures mathematical rules are
followed and forces consideration of a complete set of alternatives. This in turn gives the analyst a rational
basis to judge whether the probability distribution is an accurate reflection of the analyst’s beliefs.
3-40. Assignments of probability require a complete set of non-overlapping (mutually exclusive) answers,
events, scenarios, or COAs. In addition, misuse can feed availability and anchoring biases.
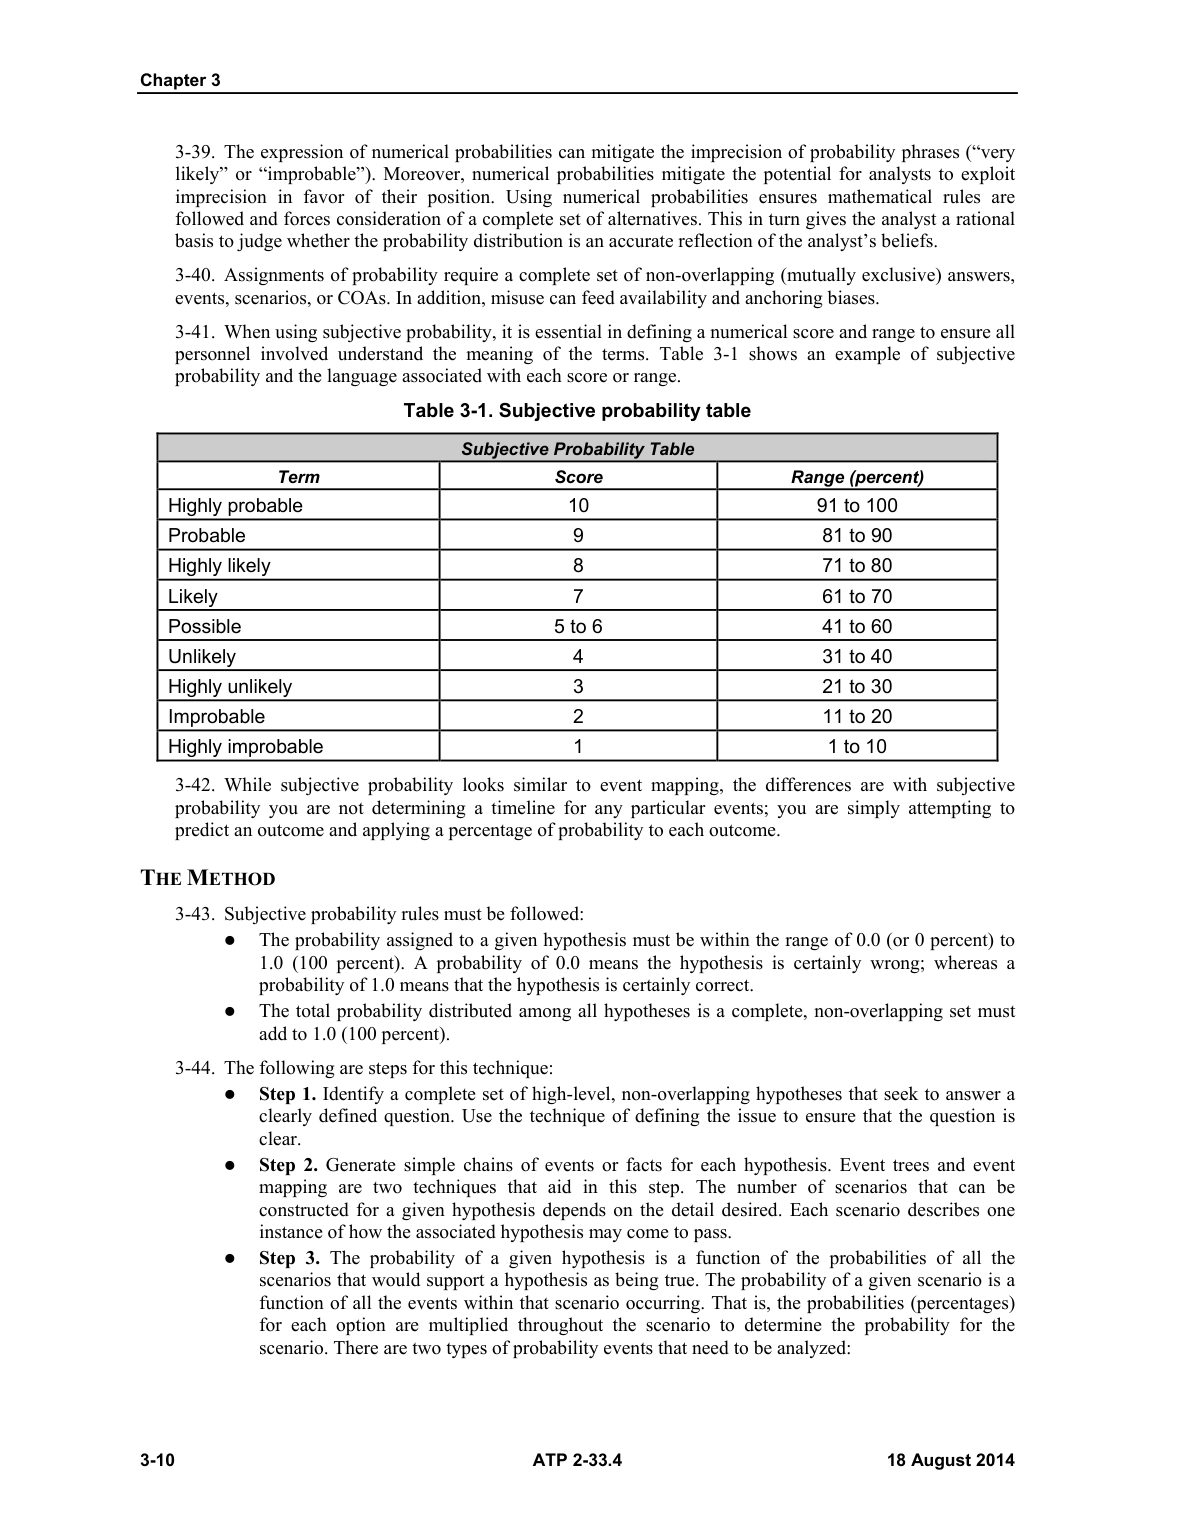
3-41. When using subjective probability, it is essential in defining a numerical score and range to ensure all
personnel involved understand the meaning of the terms. Table 3-1 shows an example of subjective
probability and the language associated with each score or range.
Table 3-1. Subjective probability table
Subjective Probability Table
| torm TScore Range (percent)
Highly probable 91 to 100
Probable [3s 84 t090
Highly kely re 71 t080
Likely 61 to 70
41 10 60
Unlikely 31 0.40
Highly untikely 21 to 30
Improbable 1410 20
Highly improbable 11010
3-42. While subjective probability looks similar to event mapping, the differences are with subjective
probability you are not determining a timeline for any particular events; you are simply attempting to
predict an outcome and applying a percentage of probability to each outcome.
THE METHOD
3-43. Subjective probability rules must be followed:
e The probability assigned to a given hypothesis must be within the range of 0.0 (or 0 percent) to
1.0 (100 percent). A probability of 0.0 means the hypothesis is certainly wrong; whereas a
probability of 1.0 means that the hypothesis is certainly correct.
e@ = The total probability distributed among all hypotheses is a complete, non-overlapping set must
add to 1.0 (100 percent).
3-44. The following are steps for this technique:
e@ Step 1. Identify a complete set of high-level, non-overlapping hypotheses that seek to answer a
clearly defined question. Use the technique of defining the issue to ensure that the question is
clear.
e@ Step 2. Generate simple chains of events or facts for each hypothesis. Event trees and event
mapping are two techniques that aid in this step. The number of scenarios that can be
constructed for a given hypothesis depends on the detail desired. Each scenario describes one
instance of how the associated hypothesis may come to pass.
© Step 3. The probability of a given hypothesis is a function of the probabilities of all the
scenarios that would support a hypothesis as being true. The probability of a given scenario is a
function of all the events within that scenario occurring. That is, the probabilities (percentages)
for each option are multiplied throughout the scenario to determine the probability for the
scenario. There are two types of probability events that need to be analyzed:
3-10 ATP 2-33.4 18 August 2014
Chapter 3
3-10
ATP 2-33.4
18 August 2014
3-39. The expression of numerical probabilities can mitigate the imprecision of probability phrases (“very
likely” or “improbable”). Moreover, numerical probabilities mitigate the potential for analysts to exploit
imprecision in favor of their position. Using numerical probabilities ensures mathematical rules are
followed and forces consideration of a complete set of alternatives. This in turn gives the analyst a rational
basis to judge whether the probability distribution is an accurate reflection of the analyst’s beliefs.
3-40. Assignments of probability require a complete set of non-overlapping (mutually exclusive) answers,
events, scenarios, or COAs. In addition, misuse can feed availability and anchoring biases.
3-41. When using subjective probability, it is essential in defining a numerical score and range to ensure all
personnel involved understand the meaning of the terms. Table 3-1 shows an example of subjective
probability and the language associated with each score or range.
Table 3-1. Subjective probability table
Subjective Probability Table
Term
Score
Range (percent)
Highly probable
10
91 to 100
Probable
9
81 to 90
Highly likely
8
71 to 80
Likely
7
61 to 70
Possible
5 to 6
41 to 60
Unlikely
4
31 to 40
Highly unlikely
3
21 to 30
Improbable
2
11 to 20
Highly improbable
1
1 to 10
3-42. While subjective probability looks similar to event mapping, the differences are with subjective
probability you are not determining a timeline for any particular events; you are simply attempting to
predict an outcome and applying a percentage of probability to each outcome.
THE METHOD
3-43. Subjective probability rules must be followed:
The probability assigned to a given hypothesis must be within the range of 0.0 (or 0 percent) to
1.0 (100 percent). A probability of 0.0 means the hypothesis is certainly wrong; whereas a
probability of 1.0 means that the hypothesis is certainly correct.
The total probability distributed among all hypotheses is a complete, non-overlapping set must
add to 1.0 (100 percent).
3-44. The following are steps for this technique:
Step 1. Identify a complete set of high-level, non-overlapping hypotheses that seek to answer a
clearly defined question. Use the technique of defining the issue to ensure that the question is
clear.
Step 2. Generate simple chains of events or facts for each hypothesis. Event trees and event
mapping are two techniques that aid in this step. The number of scenarios that can be
constructed for a given hypothesis depends on the detail desired. Each scenario describes one
instance of how the associated hypothesis may come to pass.
Step 3. The probability of a given hypothesis is a function of the probabilities of all the
scenarios that would support a hypothesis as being true. The probability of a given scenario is a
function of all the events within that scenario occurring. That is, the probabilities (percentages)
for each option are multiplied throughout the scenario to determine the probability for the
scenario. There are two types of probability events that need to be analyzed: