ATP 2-33.4, page 78
Intelligence Analysis
Army Techniques Publication: Intelligence Analysis
2014 public edition (Archive.org)
Searchable page text (OCR / PDF)
Chapter 5
5-24
ATP 2-33.4
18 August 2014
5-88. Network density does not consider how distributed the connections are between the nodes in a
network. Better metrics of group and organizational performance would be network centrality and core-
periphery. A few nodes with a high number of connections can push up the group network density, even
though the majority of the people nodes are only marginally linked to the group. In the case of a highly
centralized network dominated by one or a few very connected nodes, these nodes can be removed or
damaged to fragment the group further into sub-networks.
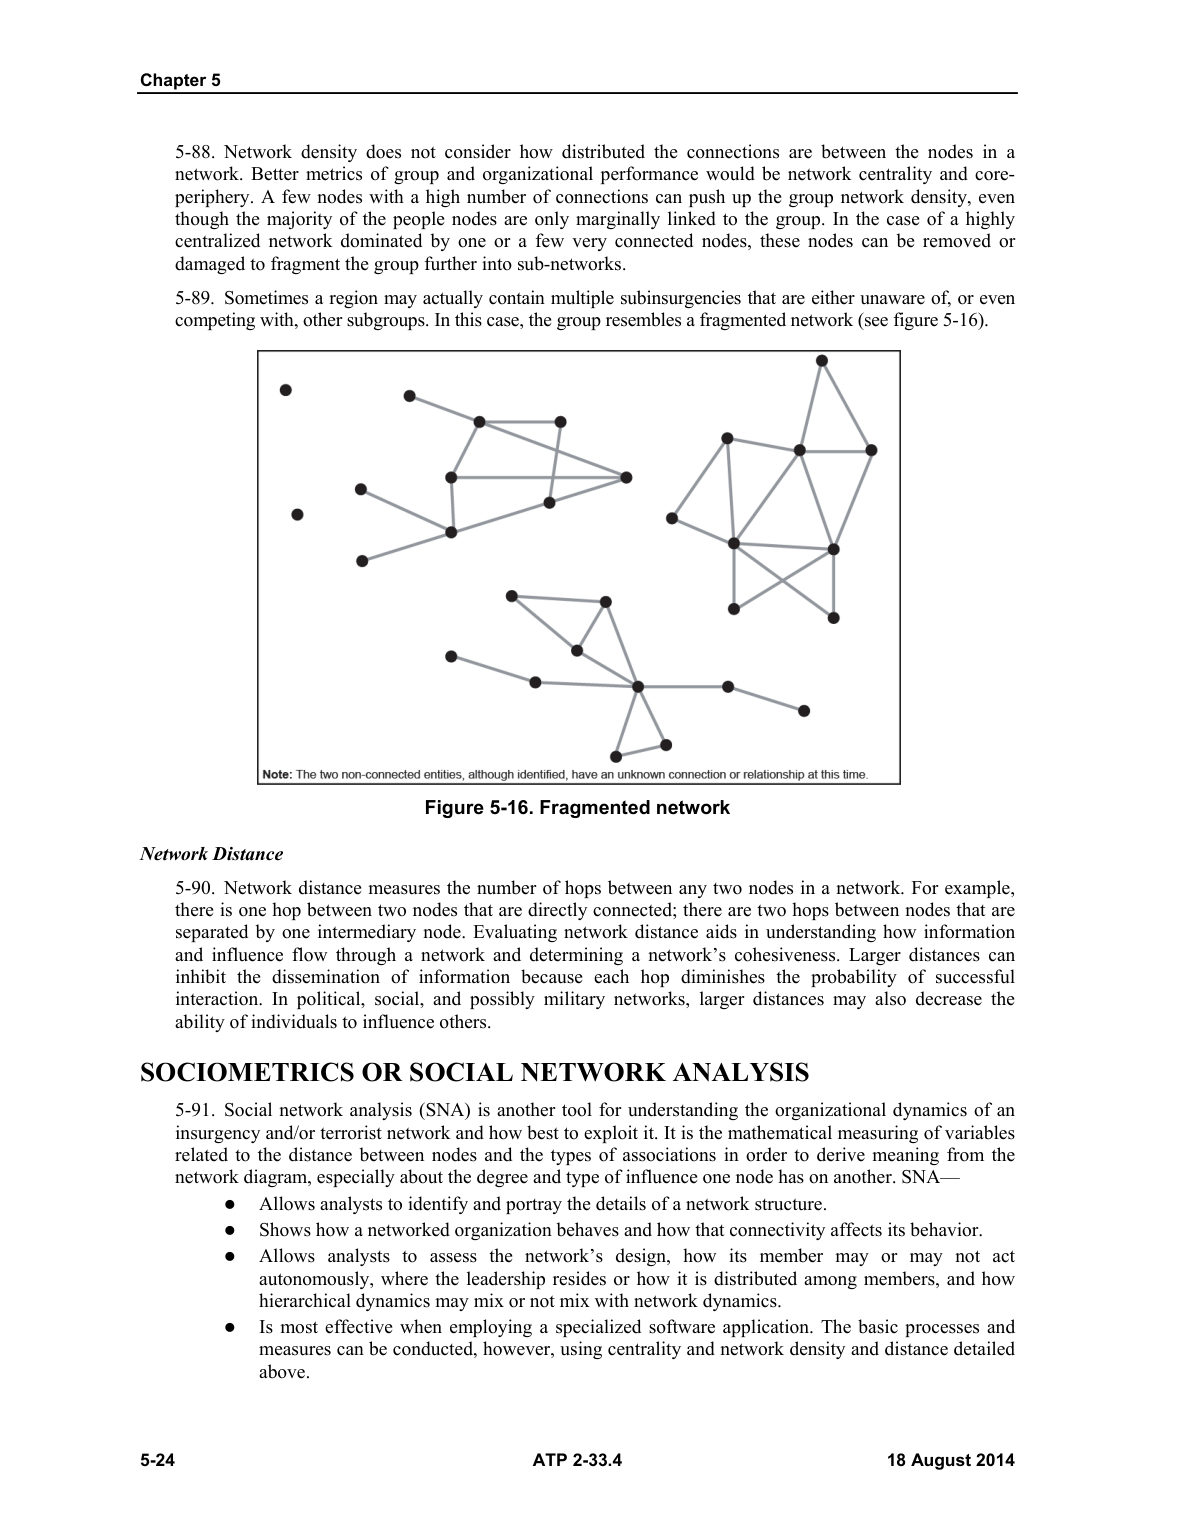
5-89. Sometimes a region may actually contain multiple subinsurgencies that are either unaware of, or even
competing with, other subgroups. In this case, the group resembles a fragmented network (see figure 5-16).
Figure 5-16. Fragmented network
Network Distance
5-90. Network distance measures the number of hops between any two nodes in a network. For example,
there is one hop between two nodes that are directly connected; there are two hops between nodes that are
separated by one intermediary node. Evaluating network distance aids in understanding how information
and influence flow through a network and determining a network’s cohesiveness. Larger distances can
inhibit the dissemination of information because each hop diminishes the probability of successful
interaction. In political, social, and possibly military networks, larger distances may also decrease the
ability of individuals to influence others.
SOCIOMETRICS OR SOCIAL NETWORK ANALYSIS
5-91. Social network analysis (SNA) is another tool for understanding the organizational dynamics of an
insurgency and/or terrorist network and how best to exploit it. It is the mathematical measuring of variables
related to the distance between nodes and the types of associations in order to derive meaning from the
network diagram, especially about the degree and type of influence one node has on another. SNA—
Allows analysts to identify and portray the details of a network structure.
Shows how a networked organization behaves and how that connectivity affects its behavior.
Allows analysts to assess the network’s design, how its member may or may not act
autonomously, where the leadership resides or how it is distributed among members, and how
hierarchical dynamics may mix or not mix with network dynamics.
Is most effective when employing a specialized software application. The basic processes and
measures can be conducted, however, using centrality and network density and distance detailed
above.